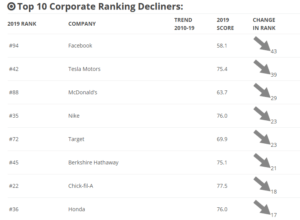

If you think Samsung can’t get over blowing up batteries and Telsa can do no wrong… your wrong 🙂 . Samsung moved up 28 places between 2018 and 2019 while Tesla dropped a stunning 39 places in the same period.
The following research conducted by Harris Insights and Analytics with Axios Research is an annual consumer survey that ranks the the top 100 companies. It is different from most surveys because it is done in two parts.
The most useful information from this report is the year over year changes which we show below.
| 2019 RANK | COMPANY | TREND 2010-19 | 2019 SCORE | CHANGE IN RANK | ||
|---|---|---|---|---|---|---|
| #94 | 58.1 |   | + | |||
| #42 | Tesla Motors | 75.4 |   | + | ||
| #88 | McDonald’s | 63.7 | + | |||
| #35 | Nike | 76.0 | + | |||
| #72 | Target | 69.9 | + | |||
| #45 | Berkshire Hathaway | 75.1 | + | |||
| #22 | Chick-fil-A | 77.5 | + | |||
| #36 | Honda | 76.0 | + | |||
| #49 | IBM | 74.3 | + | |||
| #68 | Yum! Brands | 71.4 | + | |||
| 2019 RANK | COMPANY | TREND 2010-19 | 2019 SCORE | CHANGE IN RANK | ||
|---|---|---|---|---|---|---|
| #7 | Samsung | 80.0 | + | |||
| #16 | Hobby Lobby | 78.9 | + | |||
| #10 | Sony | 79.4 | + | |||
| #53 | 21st Century Fox | 73.4 | + | |||
| #17 | USAA | 78.8 | + | |||
| #12 | The Home Depot | 79.1 | + | |||
| #8 | Procter & Gamble | 79.8 | + | |||
| #25 | Unilever | 77.3 | + | |||
| #34 | Best Buy | 76.1 | + | |||
| #4 | L.L. Bean | 80.7 | + | |||
| 2019 RANK | COMPANY | TREND 2010-19 | 2019 SCORE | CHANGE IN RANK | ||
|---|---|---|---|---|---|---|
| #1 | Wegmans | 83.0 | + | |||
| #2 | Amazon | 82.3 | + | |||
| #3 | Patagonia | 81.4 | + | |||
| #4 | L.L. Bean | 80.7 | + | |||
| #5 | Walt Disney | 80.4 | n/a | + | ||
| #6 | Publix | 80.3 | + | |||
| #7 | Samsung | 80.0 | + | |||
| #8 | Procter & Gamble | 79.8 | + | |||
| #9 | Microsoft | 79.7 | + | |||
| #10 | Sony | 79.4 | + | |||
If you dig into the survey a bit more you can answer simple perception questions like:
This website uses cookies.