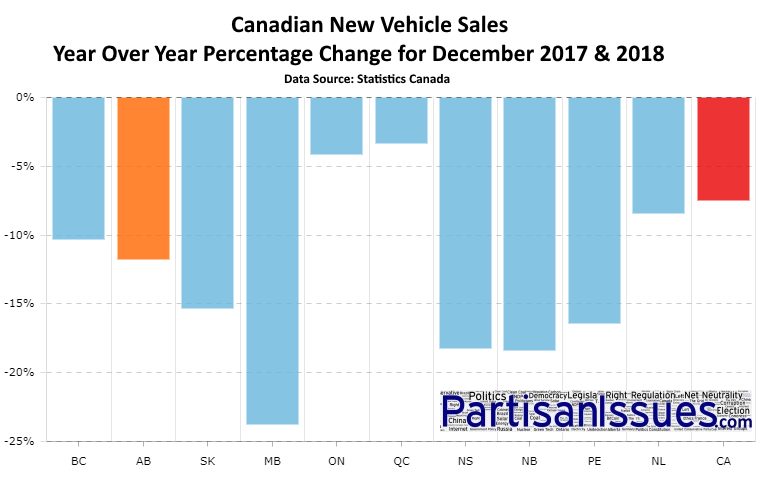
Much is being made about the 12% decline in new vehicle sales in Alberta this past December. It is being attributed to the price of “Western Canadian Select” oil collapsing in the fall of 2018 and the Notely NDP Governments response to it. Also, Oshawa Ontario’s GM plant closure has caused much news relating to how many vehicles are sold in Ontario and how the plant closure will affect GM sales going forward.
We wanted to know what the numbers really were and so we dug into the Statistics Canada public database via the Alberta Governments new Economic Dashboard and here is what we found.
As you can see yes, Alberta did have a major drop in new vehicle sales in December but much less than other Canadian Provinces like Manitoba.
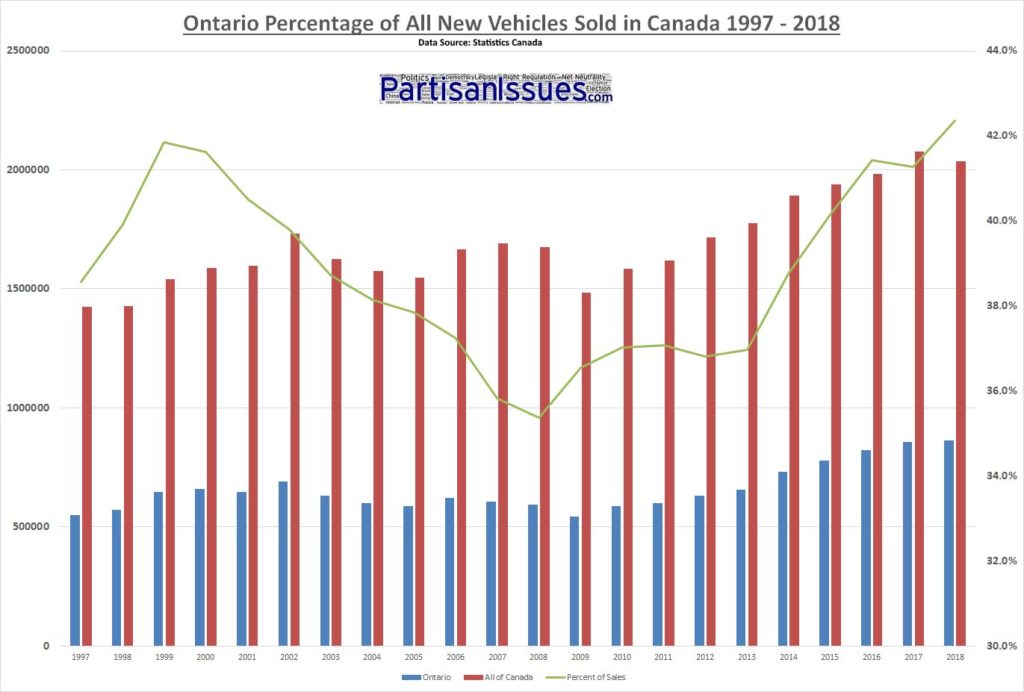
We also found that Ontario has been increasing it’s share of new passenger vehicle sales since the economic collapse in 2008 which makes it particularly sensitive for major manufacturers like General Motors.
Here are the raw numbers if you want to play with them yourself:
Ontario Percentage of New Passenger Vehicle Sales
| Year | Ontario | All of Canada | Percent of Sales |
| 1997 | 549423 | 1424380 | 38.6% |
| 1998 | 570528 | 1428932 | 39.9% |
| 1999 | 645470 | 1542041 | 41.9% |
| 2000 | 660820 | 1587561 | 41.6% |
| 2001 | 647300 | 1597964 | 40.5% |
| 2002 | 689668 | 1733318 | 39.8% |
| 2003 | 629774 | 1626468 | 38.7% |
| 2004 | 600928 | 1575195 | 38.1% |
| 2005 | 586022 | 1548291 | 37.8% |
| 2006 | 620649 | 1666327 | 37.2% |
| 2007 | 605799 | 1690538 | 35.8% |
| 2008 | 592088 | 1674145 | 35.4% |
| 2009 | 542609 | 1484856 | 36.5% |
| 2010 | 586633 | 1584499 | 37.0% |
| 2011 | 600668 | 1620577 | 37.1% |
| 2012 | 632066 | 1716803 | 36.8% |
| 2013 | 656684 | 1776461 | 37.0% |
| 2014 | 732718 | 1890387 | 38.8% |
| 2015 | 778716 | 1939517 | 40.1% |
| 2016 | 821762 | 1983745 | 41.4% |
| 2017 | 857155 | 2076945 | 41.3% |
| 2018 | 862307 | 2035732 | 42.4% |
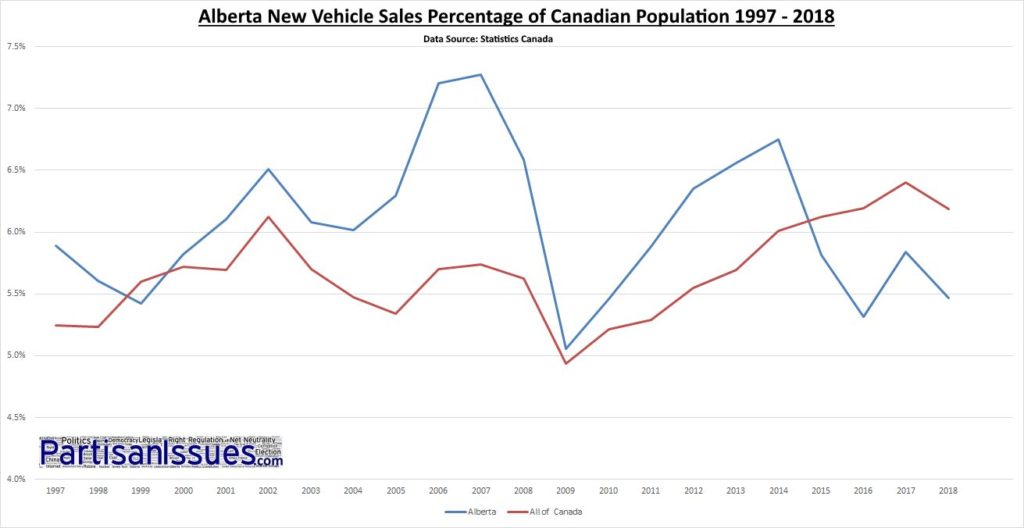
New Vehicle Sales in Alberta and In the Canadian Population
| Year | Alberta New Vehicle Sales | Alberta Population | Canadian Population | Canadian New Vehicle Sales | ||
| 1997 | 167671 | 2847526 | 5.9% | 27147264 | 1424380 | 5.2% |
| 1998 | 163395 | 2915781 | 5.6% | 27315858 | 1428932 | 5.2% |
| 1999 | 160838 | 2966682 | 5.4% | 27525424 | 1542041 | 5.6% |
| 2000 | 175546 | 3016947 | 5.8% | 27767022 | 1587561 | 5.7% |
| 2001 | 187863 | 3078336 | 6.1% | 28050783 | 1597964 | 5.7% |
| 2002 | 204806 | 3144926 | 6.5% | 28306838 | 1733318 | 6.1% |
| 2003 | 194451 | 3197858 | 6.1% | 28540011 | 1626468 | 5.7% |
| 2004 | 196153 | 3260590 | 6.0% | 28779369 | 1575195 | 5.5% |
| 2005 | 210710 | 3346754 | 6.3% | 29007214 | 1548291 | 5.3% |
| 2006 | 248731 | 3453944 | 7.2% | 29226768 | 1666327 | 5.7% |
| 2007 | 257050 | 3533413 | 7.3% | 29468725 | 1690538 | 5.7% |
| 2008 | 238413 | 3619292 | 6.6% | 29753126 | 1674145 | 5.6% |
| 2009 | 186768 | 3694303 | 5.1% | 30062774 | 1484856 | 4.9% |
| 2010 | 204537 | 3747226 | 5.5% | 30384457 | 1584499 | 5.2% |
| 2011 | 224147 | 3807726 | 5.9% | 30650272 | 1620577 | 5.3% |
| 2012 | 247785 | 3900333 | 6.4% | 30935675 | 1716803 | 5.5% |
| 2013 | 263224 | 4010903 | 6.6% | 31200963 | 1776461 | 5.7% |
| 2014 | 277191 | 4106056 | 6.8% | 31452991 | 1890387 | 6.0% |
| 2015 | 241976 | 4159519 | 5.8% | 31663375 | 1939517 | 6.1% |
| 2016 | 223651 | 4210052 | 5.3% | 32046055 | 1983745 | 6.2% |
| 2017 | 248813 | 4262642 | 5.8% | 32450016 | 2076945 | 6.4% |
| 2018 | 236798 | 4330206 | 5.5% | 32912365 | 2035732 | 6.2% |
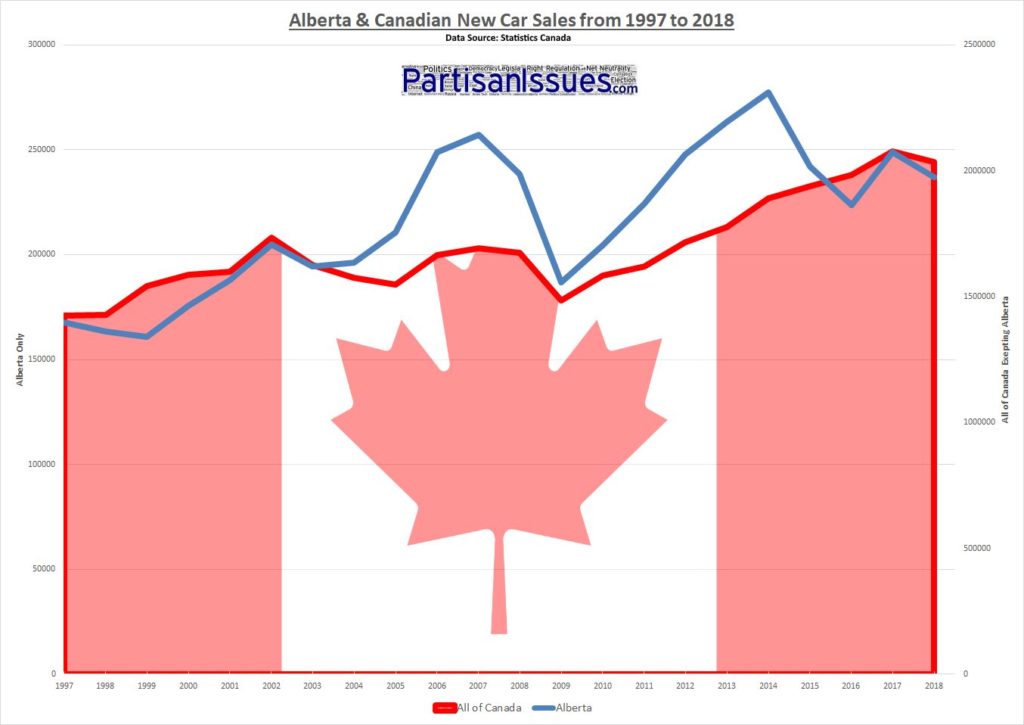
New Passenger Vehicle Sales In Canada by Province 1997 – 2018
| Alberta | Sask | Manitoba | BC | Quebec | Ontario | Nova Scotia | New Brunswick | PEI | NFL | Canada | |
| 1997 | 167671 | 42521 | 47562 | 164426 | 352249 | 549423 | 38423 | 36403 | 4717 | 20985 | 1424380 |
| 1998 | 163395 | 36056 | 43058 | 147497 | 364007 | 570528 | 40382 | 37981 | 4556 | 21472 | 1428932 |
| 1999 | 160838 | 34775 | 43359 | 157213 | 385940 | 645470 | 43374 | 41849 | 4802 | 24421 | 1542041 |
| 2000 | 175546 | 36682 | 42666 | 167770 | 390374 | 660820 | 44152 | 40790 | 4902 | 23859 | 1587561 |
| 2001 | 187863 | 38354 | 43304 | 172606 | 397757 | 647300 | 43311 | 38185 | 4635 | 24649 | 1597964 |
| 2002 | 204806 | 41585 | 49309 | 195132 | 433619 | 689668 | 47476 | 40937 | 4996 | 25790 | 1733318 |
| 2003 | 194451 | 41145 | 46062 | 180924 | 420185 | 629774 | 46360 | 37408 | 4731 | 25428 | 1626468 |
| 2004 | 196153 | 38822 | 45331 | 181605 | 405081 | 600928 | 45164 | 34517 | 4696 | 22898 | 1575195 |
| 2005 | 210710 | 37459 | 44273 | 176382 | 388171 | 586022 | 44039 | 32648 | 4645 | 23942 | 1548291 |
| 2006 | 248731 | 39915 | 45924 | 194648 | 404198 | 620649 | 47738 | 35403 | 4933 | 24188 | 1666327 |
| 2007 | 257050 | 45546 | 47099 | 201596 | 413405 | 605799 | 49187 | 37293 | 5303 | 28260 | 1690538 |
| 2008 | 238413 | 49480 | 48029 | 182080 | 435155 | 592088 | 52426 | 39522 | 5504 | 31448 | 1674145 |
| 2009 | 186768 | 44893 | 43995 | 152830 | 396574 | 542609 | 47872 | 35274 | 5286 | 28755 | 1484856 |
| 2010 | 204537 | 47599 | 45355 | 156656 | 419847 | 586633 | 47643 | 38777 | 5783 | 31669 | 1584499 |
| 2011 | 224147 | 51078 | 48546 | 160582 | 413545 | 600668 | 45897 | 39503 | 5795 | 30816 | 1620577 |
| 2012 | 247785 | 56517 | 52236 | 176319 | 423076 | 632066 | 48703 | 39895 | 6600 | 33606 | 1716803 |
| 2013 | 263224 | 59137 | 56275 | 184838 | 419472 | 656684 | 52544 | 41512 | 7336 | 35439 | 1776461 |
| 2014 | 277191 | 58434 | 57783 | 197903 | 426821 | 732718 | 53886 | 42656 | 7555 | 35440 | 1890387 |
| 2015 | 241976 | 55131 | 57986 | 211259 | 451662 | 778716 | 55057 | 44735 | 7976 | 35019 | 1939517 |
| 2016 | 223651 | 52099 | 57428 | 221772 | 465143 | 821762 | 54451 | 44984 | 8768 | 33687 | 1983745 |
| 2017 | 248813 | 56292 | 63197 | 237092 | 468810 | 857155 | 58947 | 44801 | 8587 | 33251 | 2076945 |
| 2018 | 236798 | 50192 | 67900 | 225346 | 461087 | 862307 | 52789 | 41311 | 7736 | 30266 | 2035732 |


0 Comments