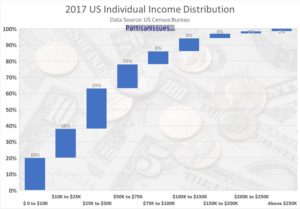

Below is a graphs showing American income distribution for individual (not households) in 2017. To get to the point, if you earn:
| US Income | # of People | Percentage of Population |
| $ 0 to $10K | 25610 | 20% |
| $10K to $25K | 22779 | 18% |
| $25K to $50K | 31600 | 25% |
| $50K to $75K | 19515 | 15% |
| $75K to $100K | 10169 | 8% |
| $100K to $150K | 9816 | 8% |
| $150K to $200K | 3941 | 3% |
| $200K to $250K | 1731 | 1.4% |
| Above $250K | 2125 | 1.6% |
This website uses cookies.